
Michael Jordan 623 Project #1: How The Market Has Grown Smarter
The market is getting smarter. You need to get smarter too.

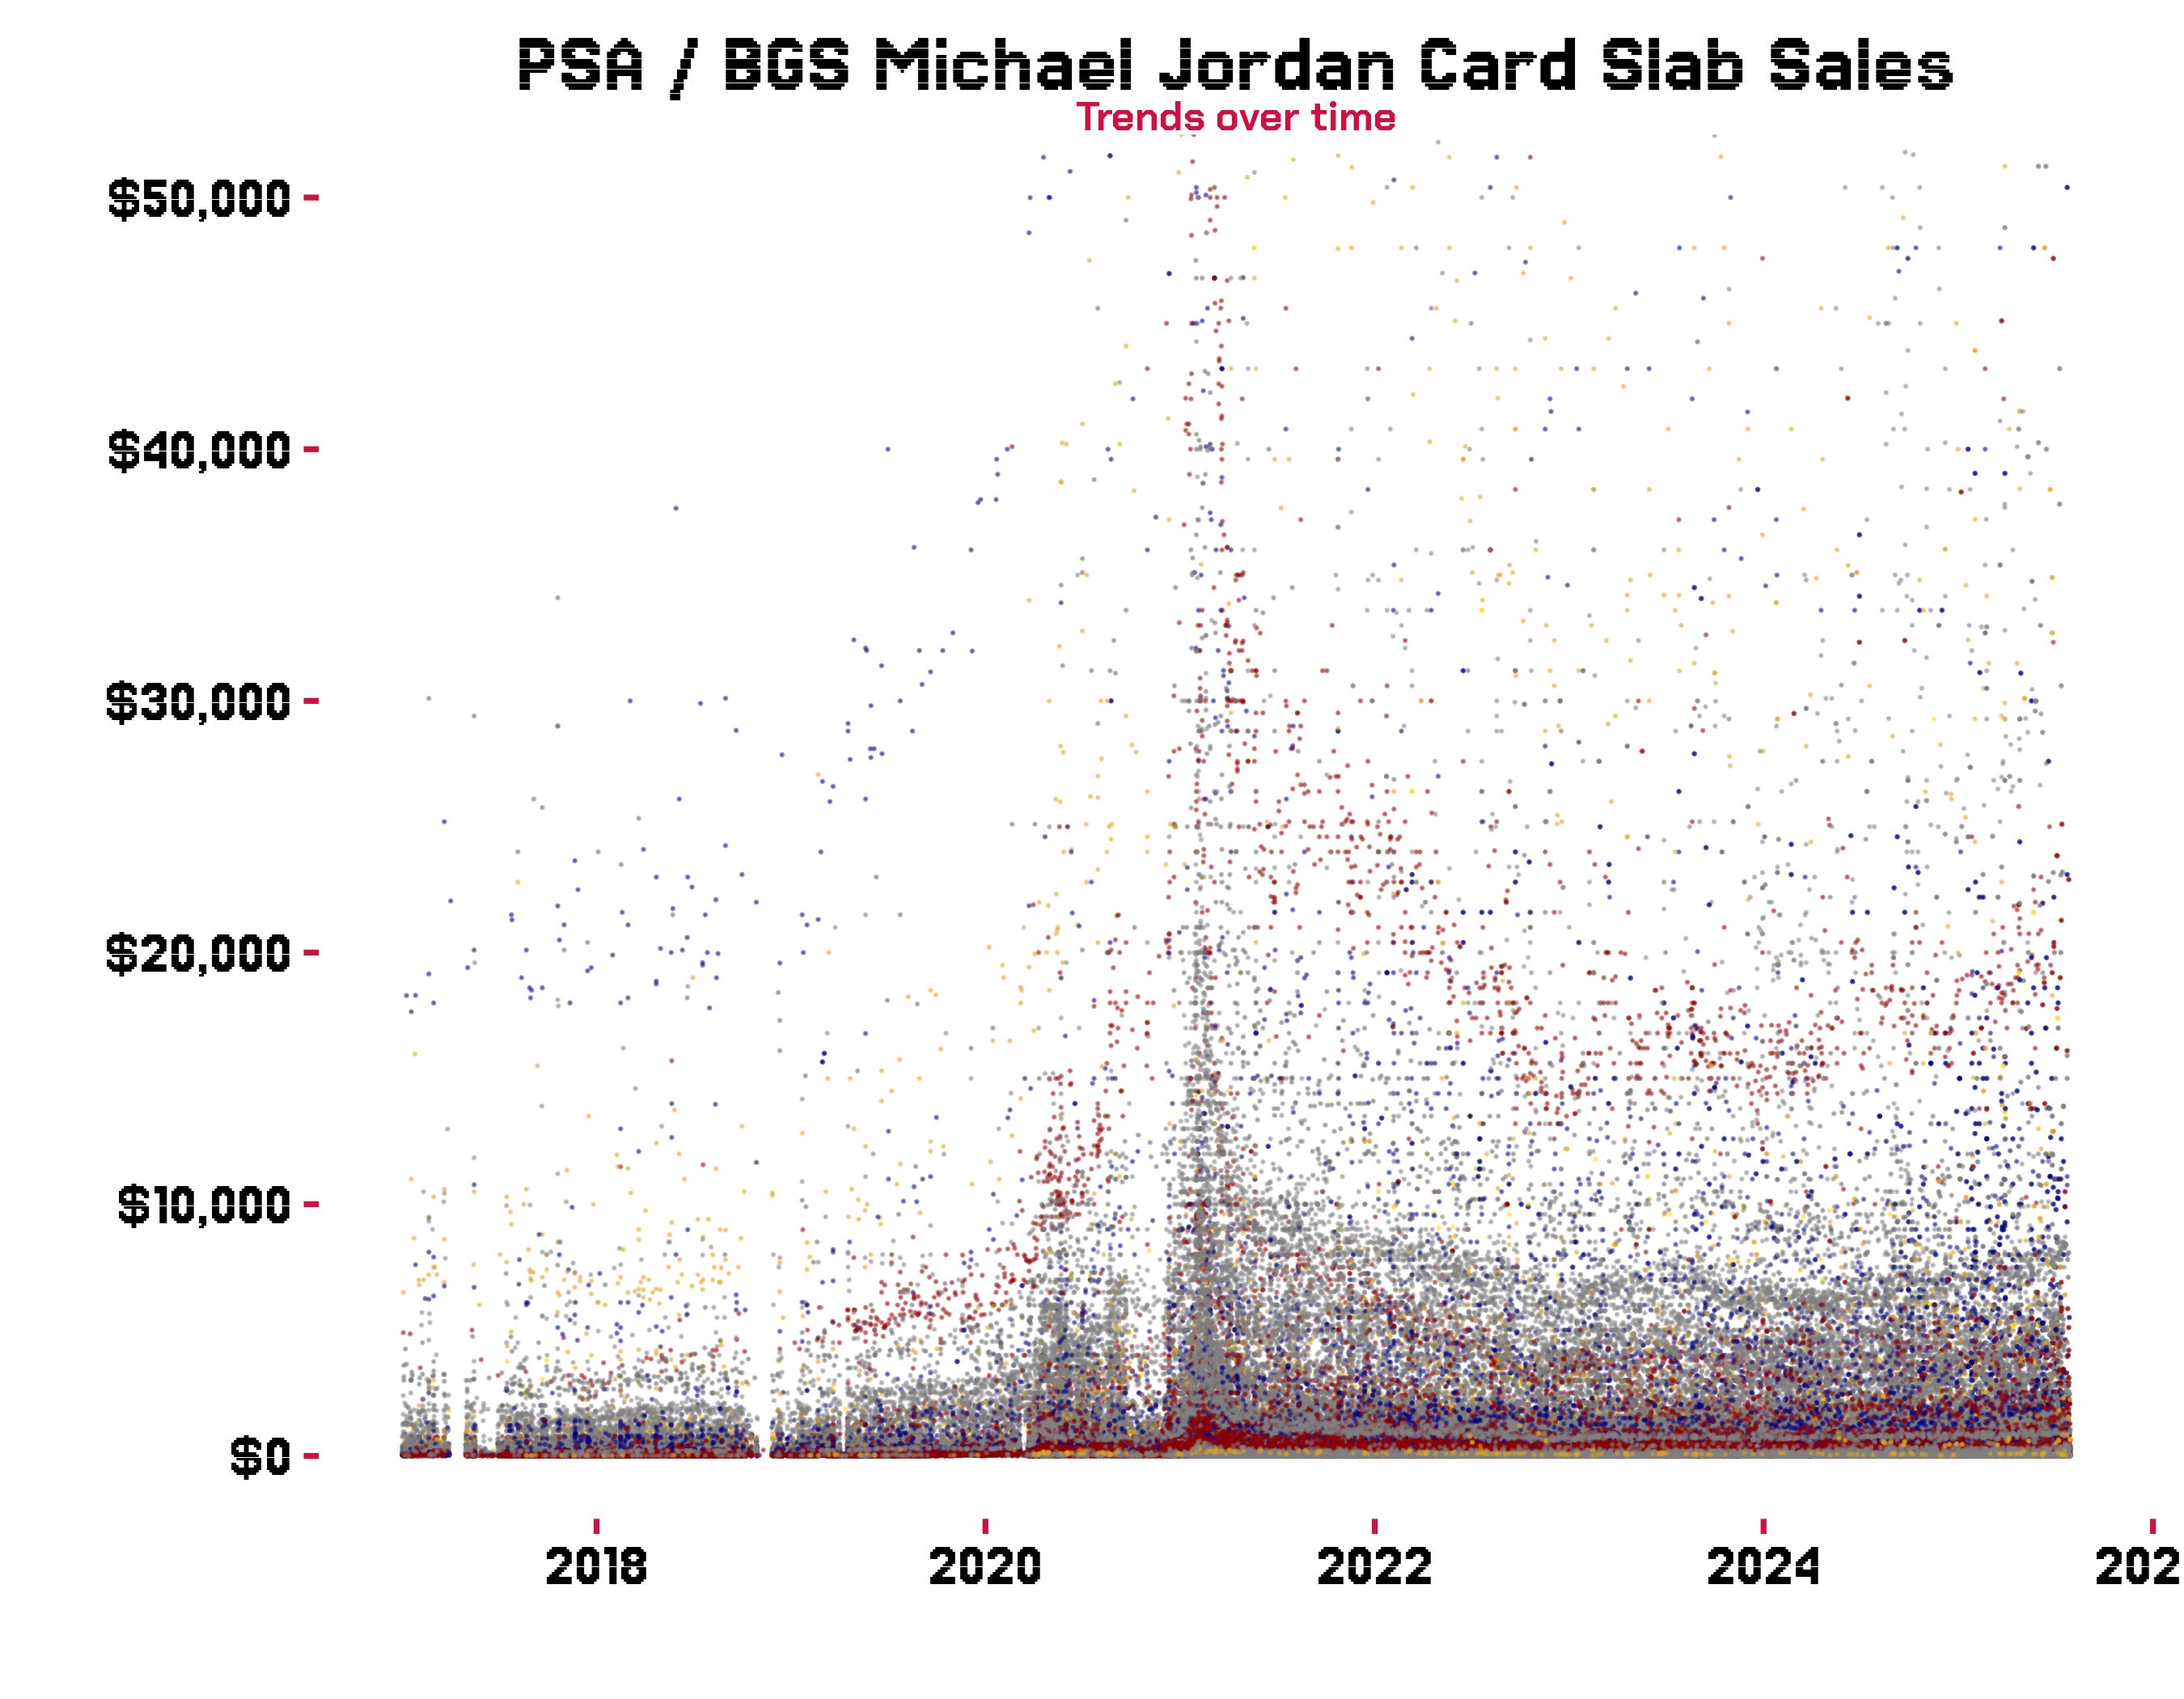
$113,502,142 worth of the most relevant slabbed Michael Jordan cards were sold publicly during the bubble year, 2021. Almost making the dots above look like they’re getting sucked into a black hole. That’s 3.2 times as much sold in 2020 which was itself was 4.4 times the sales of 2019.
$66.7M in 2022. And $51.5M in 2023. And that was it. That was the bottom.
Back up to $64M in 2024, and now through pretty much the first half of 2025 we are sitting at $47M to put us on pace for around $94M by year’s end.
Does this mean another bubble is on the way? Is the graph above starting to draw another post on what would make the second post on a bridge-looking trend with the dots?
The data seems to have the answer: No.
Here’s the thing. The market is getting smarter. A lot smarter. Let’s sharpen the focus with a lower aperture and parse out the specific slab (company / grade) for the most common Michael Jordan Cards. We’re talking any card with at least 1,000 submitted to PSA. The common man cards. Your 1990 Fleer. 1989 Hoops. Junk wax and base cards everyone knows.
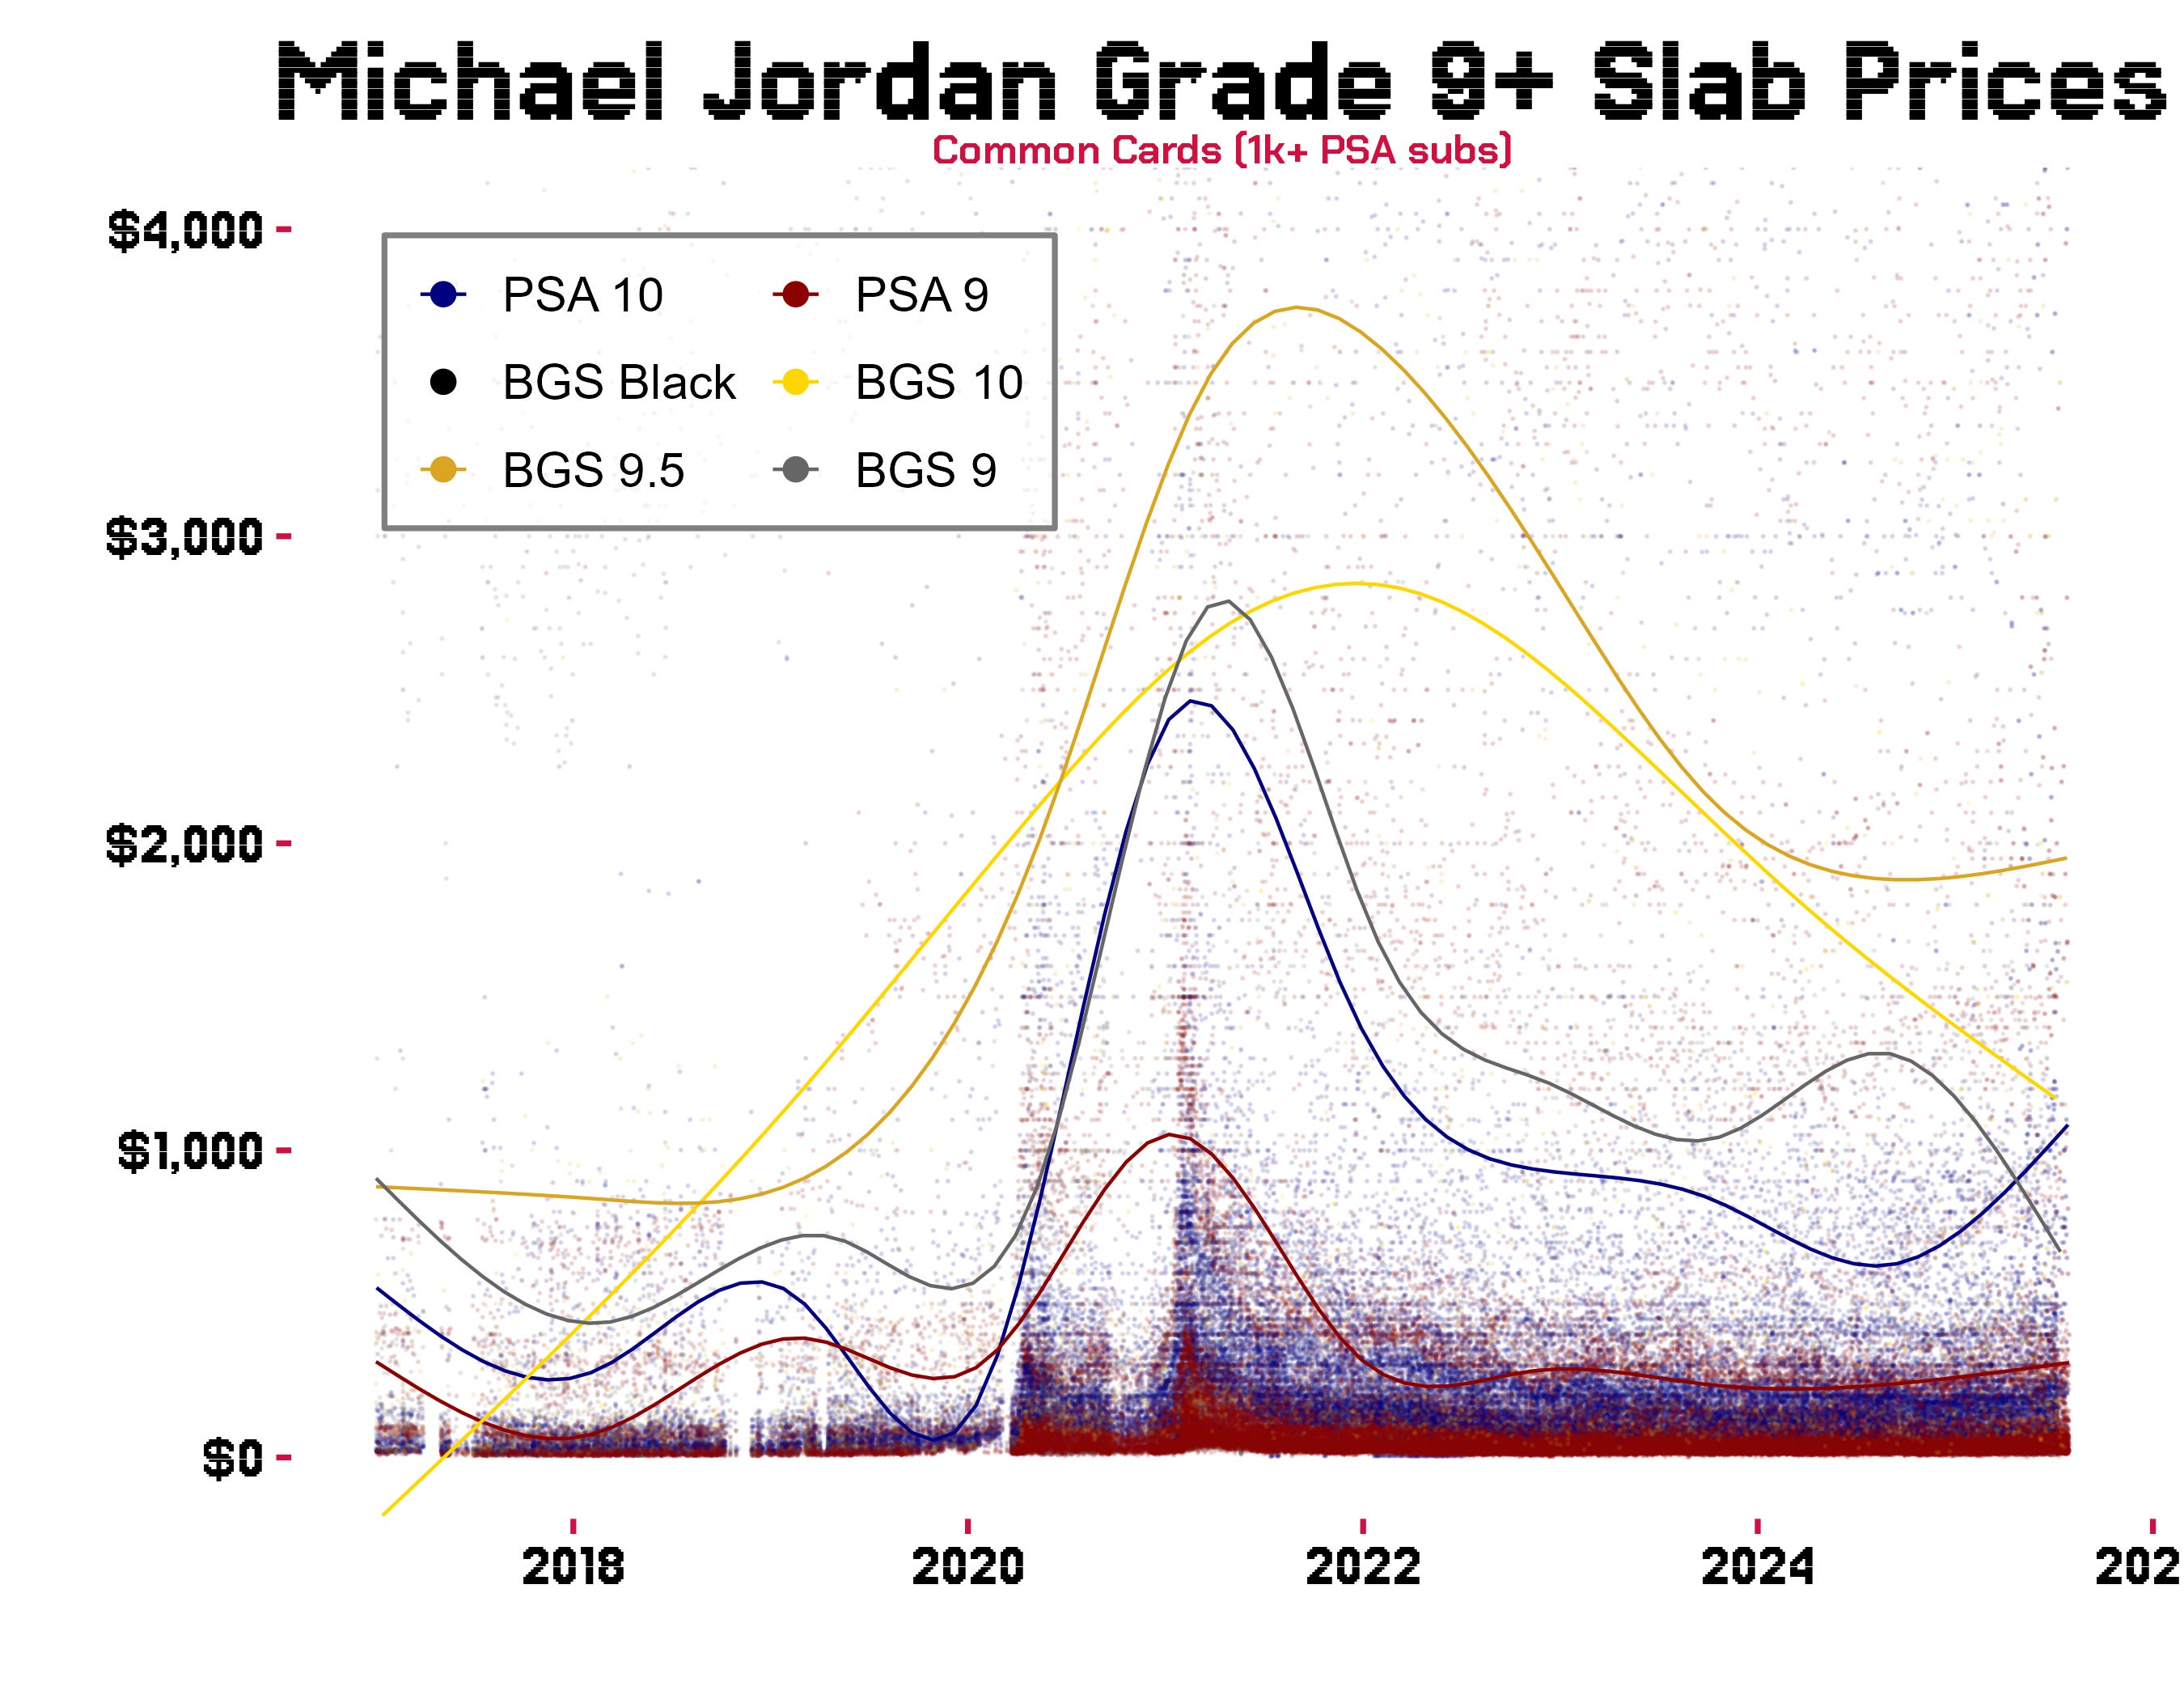
Of course - not all sales are the same. Even in the same slab/grade. But diving into all that will be a lot of the fun we have with the Substack. Right now though, we are just looking down at this from space trying to make sense of where things are at. Two things are pretty clear from above.
PSA 10s (blue line) are on the rise and PSA 9 to a lesser degree
BGS is on the downtrend (although a slight recovery for 9.5)
With PSA 10s on the rise, and 9’s to a slight degree on commodity cards, you might think this to be a trigger for a rush on the other grades. The domino affect. Once 10s go, the rest follow. But when you look back at the start of the 2021 bubble, the spikes were pretty much steady across all slab types. Although interestingly, BGS 9.5s were rising while PSA 10s dropped in 2019.
Today - the market is more selective even amongst the entry-level collectors going after these ubiquitous slabs.
What about rare Michael Jordan cards?
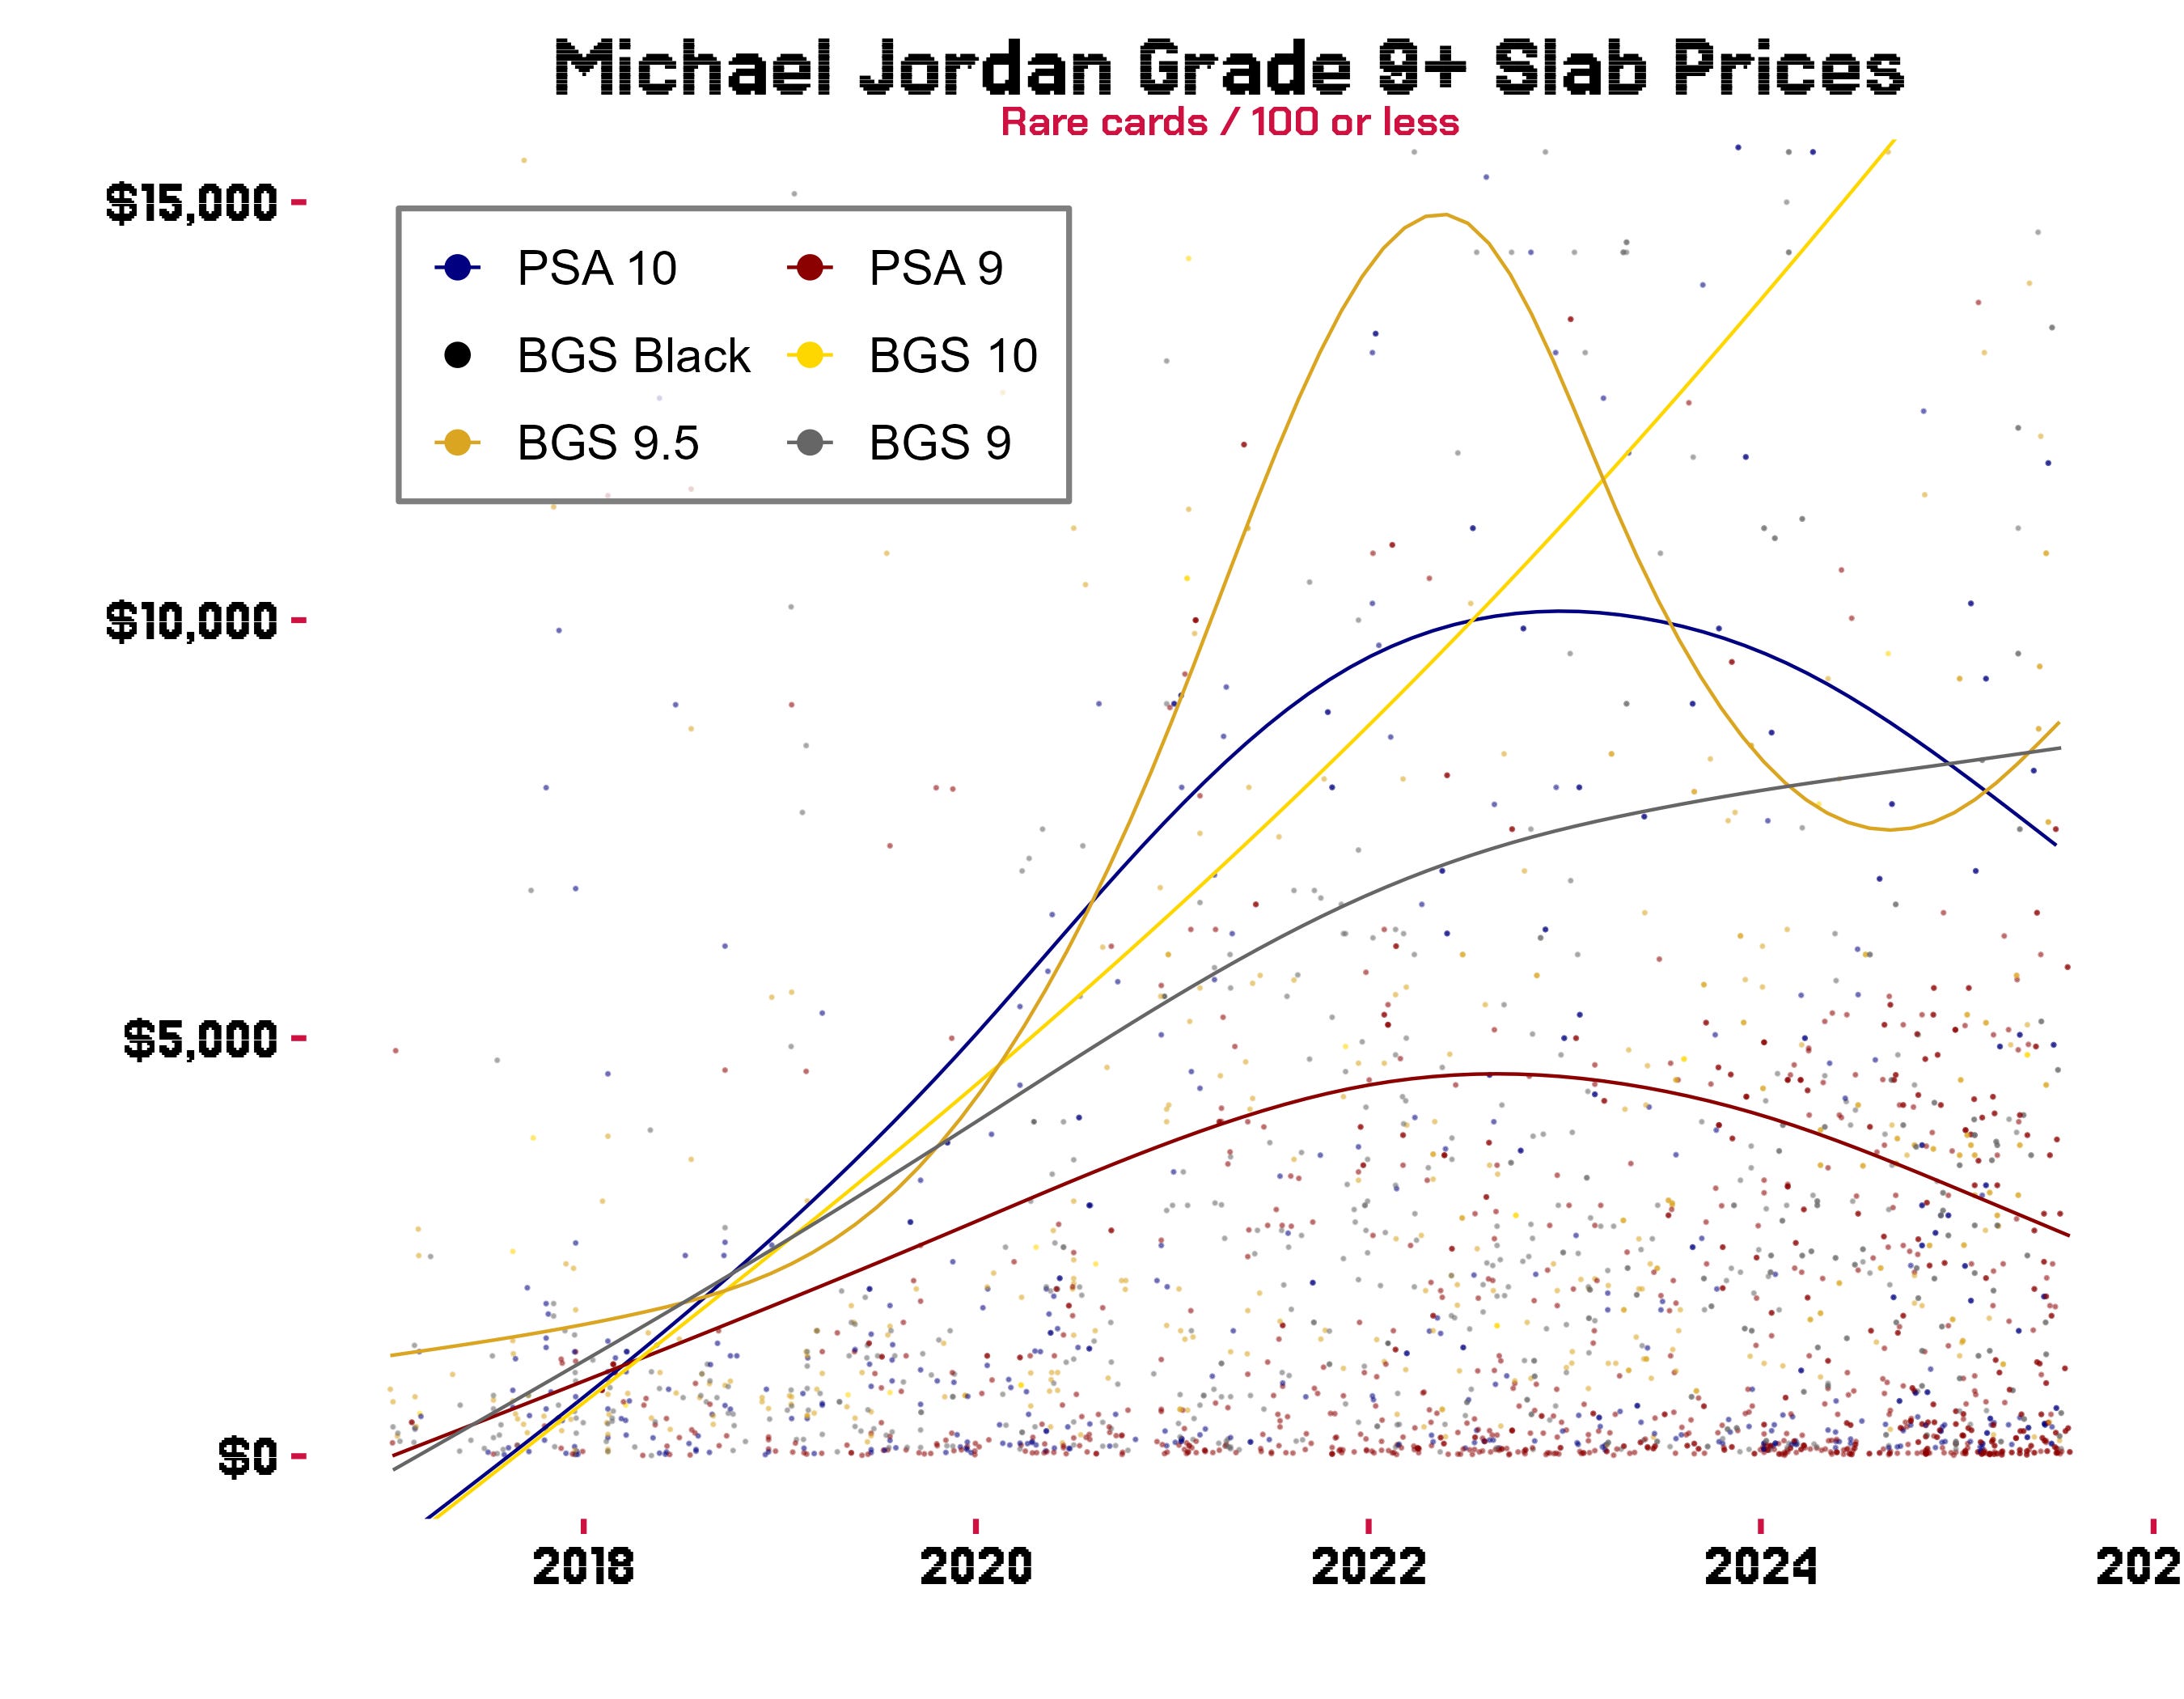
This graph might be misleading as the lower sample size, the better chance some huge value or low value sales over influences the trend lines. So keep that in mind. But despite all the record sales we see on super low pop PSA 10s (particularly on Fanatics), PSA 10s for cards submitted 100 or fewer times are still dipping in value overall. And BGS is actually going up a touch. Especially BGS 9.5 after taking a huge dive.
Turns out 2024 was a great year to buy rare BGS 9.5s. I wish I saw this when I sold my 1997 Never compromise 9.5 and Z Force Rave 9. Well… Fuck.
These graphs tell a story here. The market is getting smarter. But there’s still novices out there as suggested by the spike in PSA 10 commodity cards. Just not at the higher levels. Because of how crazy PSA cards with low pops got during the bubble, they are still selling at lower costs overall in the same slabs. That doesn’t seem to follow with BGS though. They are rising likely due to the fact that their bubble prices didn’t go bonkers in the first place.
But even the casual commodity card collector’s (CCCCs?) are getting smarter than they were in 2021. Pulling only PSA 10 cards that sold five or more times in every month since January 2022, only two qualifying cards have a positive price correlation across time.
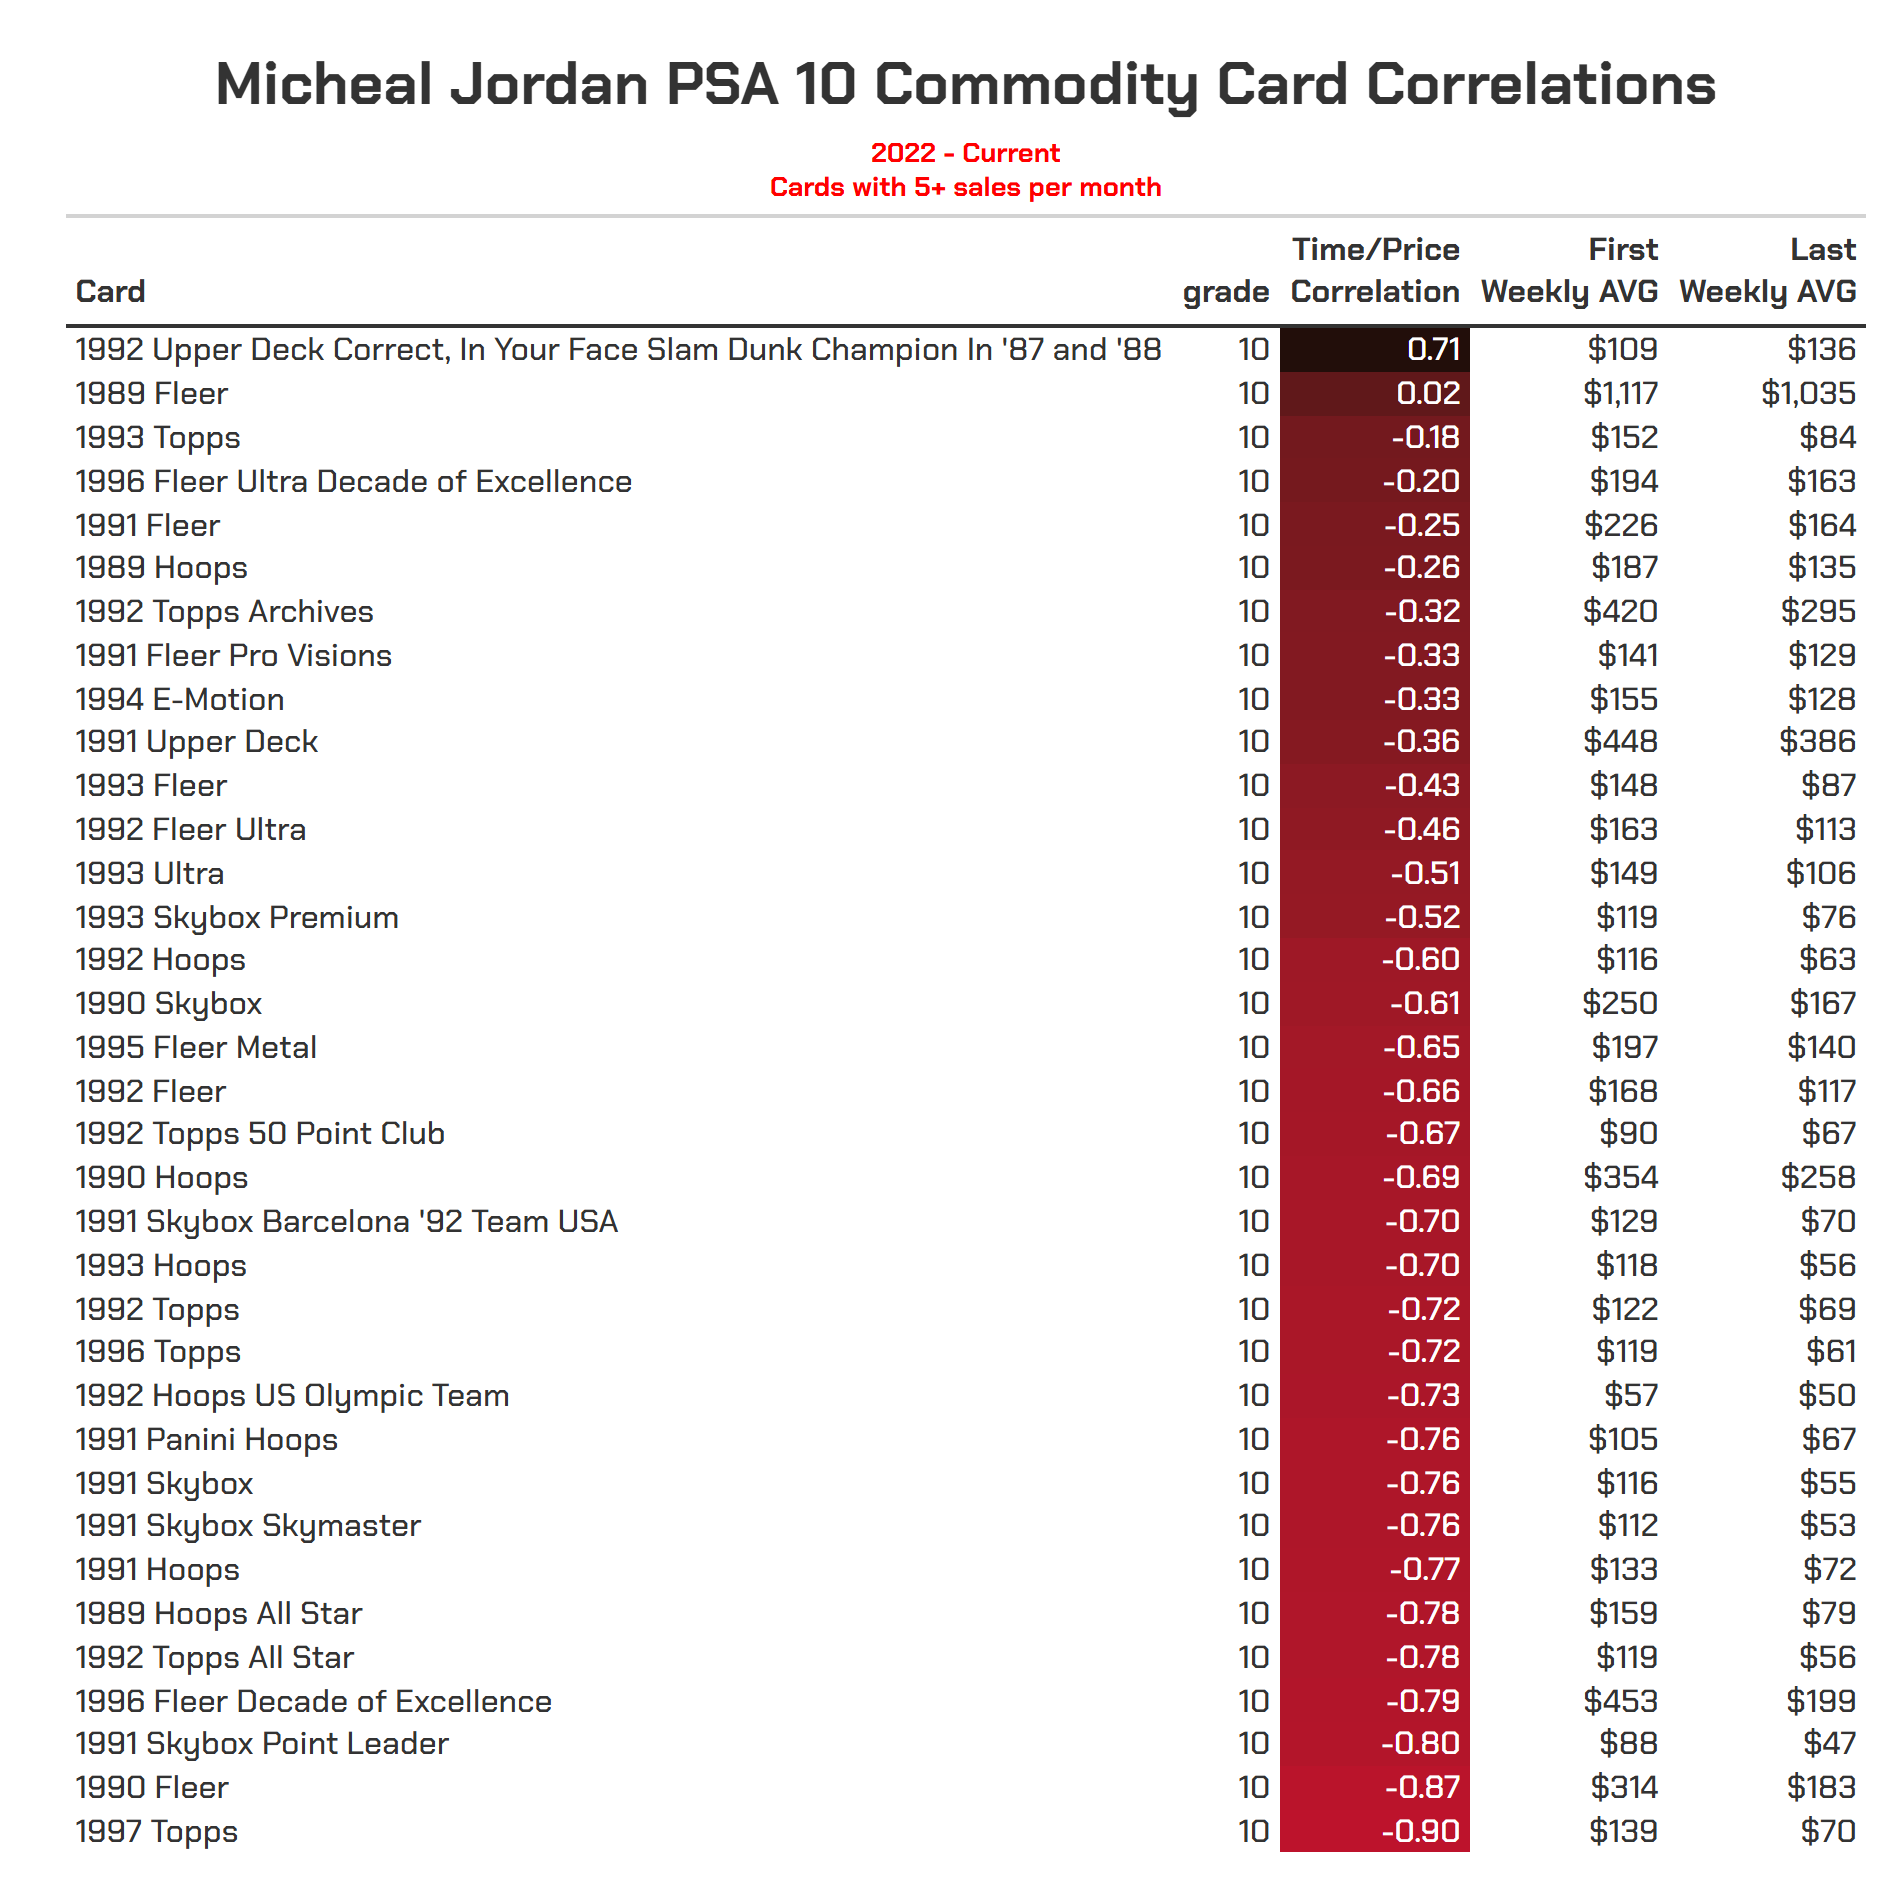
Here are those only two.
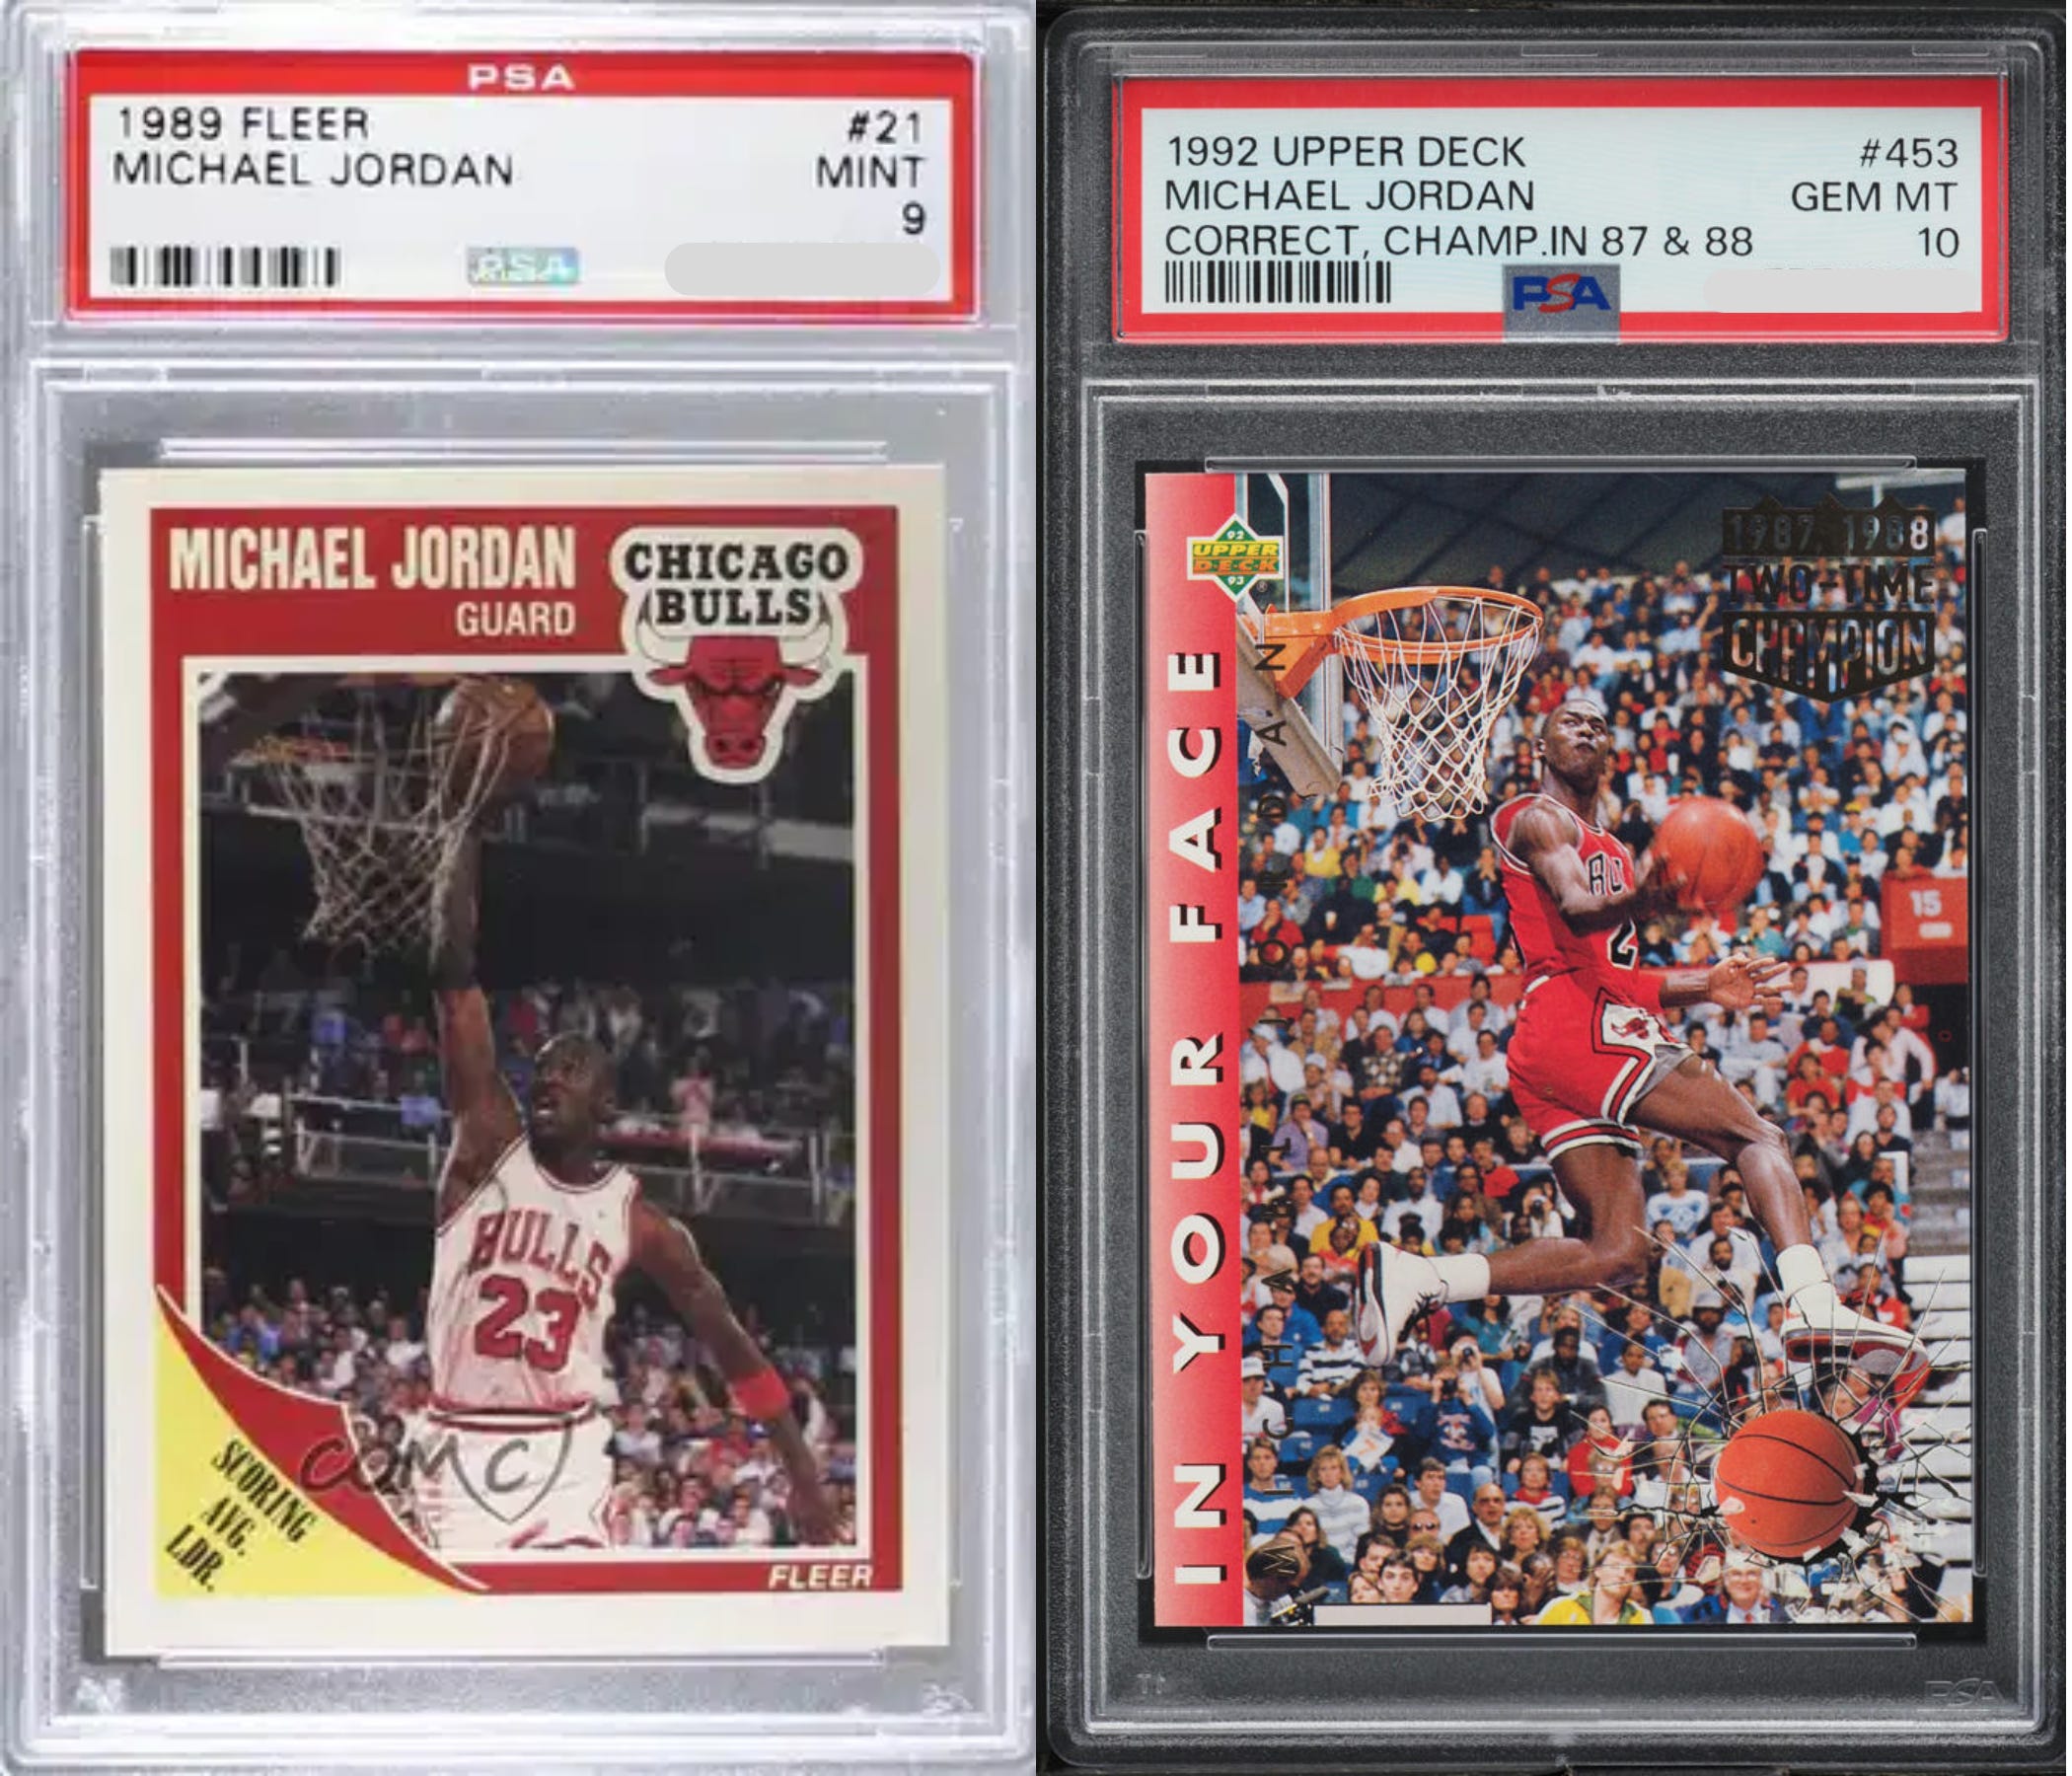
Why them? I’m not 100% sure. Pop counts hover around 1,000 on each and so does the very last card on the list - the 1997 Topps base whose price dropped in half since January 2022. Again - that’s with a starting point AFTER the bubble. The 1989 is a classic, and the dunk pose on the 1992 Upper Deck is just fantastic. But I can’t see myself in on either of these right now. But the lesson here is that overall, the market is getting smarter. Even those buying the cheap common cards. Not to say that it’s perfect. As much as I like the above two cards, I have no interest of catching them before a drop.
Just to drive the point home - here’s literally the most common of the commodity Michael Jordan cards. The 1990 Fleer #26.
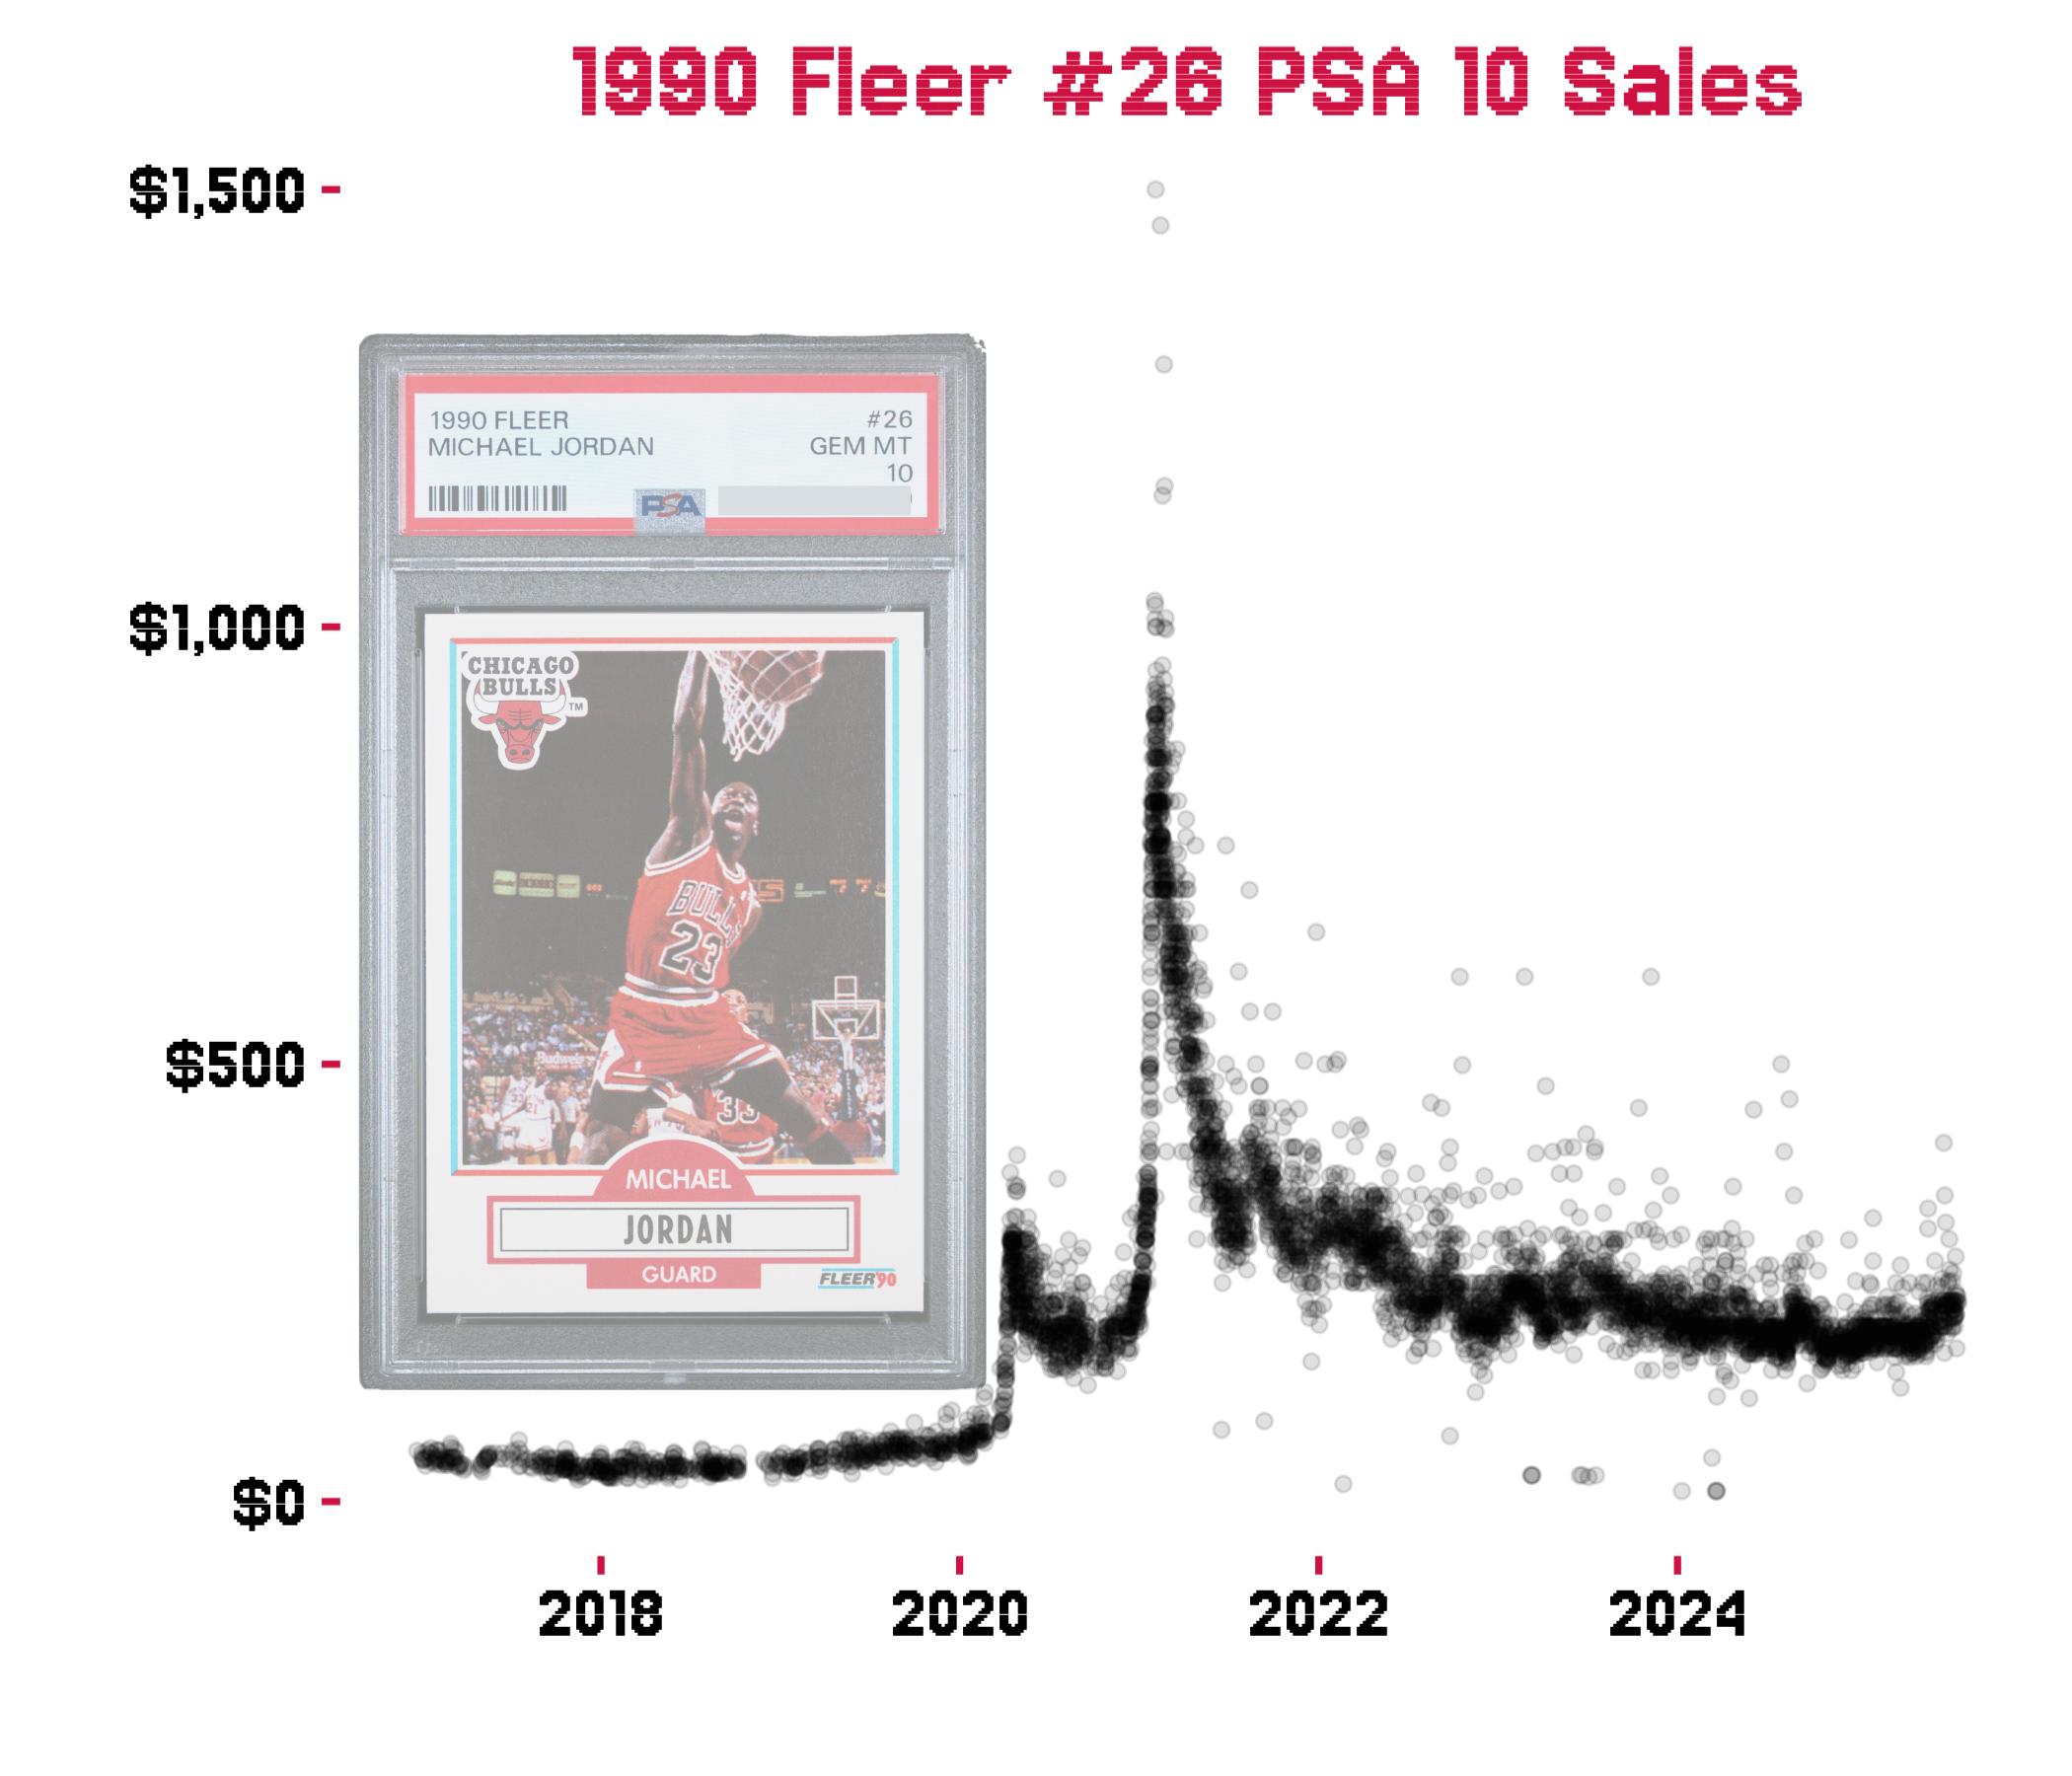
63,823 1990 Fleer #26 have been sent into to PSA for grading. No other card even comes close. 8,093 graded a 10. Insane.
I clipped out a $5,000 sale in February of 2021 which I’ll just assume wasn’t paid. But the point here is that the market isn’t really falling for this again. Sure, there’s been a slight recent uptick, but nothing that indicates it’s taking the elevator again.
If the market is getting smarter, then you need to as well. And that’s what this Substack is all about. There’s so much data to explore that will up your game as a collector. And I speak as a collector. The ultimate goal here it to get as impressive a collection as possible. For whatever budget you might have. Whether big cards or small. I have the data.
Quite frankly - no one has the data that I have at my disposal. At least not anyone that is willing to share it. As a data programmer expert, I hand selected 623 of the most relevant Michael Jordan cards from 1984-1998 (along with some 150 more actually but branding you know) and have slab sales data going back to 2017 for PSA/BGS/SGC and CGC on pretty much all grades.
But that’s just the start. I also have PSA pop counts on every card (BGS too). And I pull these pop counts every month or two so I know every card that has been added (presumably). So I can check which ones are getting sent in the most, and which you might have a chance getting a 10 or 9 on.
Hopefully this get’s you excited. Check out my About Me page and Intro article for a slew of ideas I’m looking to dive into. Probably start off diving into commodity cards with the highest to lowest PSA 10 gem rates. Then go to more rare cards from there.
Welcome to the Michael Jordan 623 Club. Get ready to boost your collection into overdrive.
Please subscribe so I know this is worth investing the time into. The first few posts will be totally free, but will also have some free portions of most if not all my posts. Follow me on Instagram!